
CPU usage after tuning
High CPU is usually a symptom.
Often the cause is a query that reads far more data than it needs.
Problem
CPU was hitting 100% several times a day. This one started as an emergency call, and the client had severe performance issues:
- Queries took 1, 5 or 10 minutes, or timed out.
- CPU reached 100% many times during the day.
We started monitoring the environment. CPU was low until 12:30 PM, then climbed to 70% and stayed there for an hour.
We found 12 long-running sessions of the same query behind it. The client told us 15 to 20 executions were enough to push CPU to 100%.
The execution plan showed an index scan on a table with 1,585,002 rows and 43 indexes. Five or six is usually enough. Disk latency also went above 20 ms while those scans ran.
Solution
This is what we did to fix the issue:
- Disabled 12 duplicate indexes on that one table.
- Raised
cost threshold for parallelismfrom 5 to 50. - Set
max degree of parallelismfrom 0 (all cores) to 8. - Turned on
optimize for ad hoc workloads.
And we added monitoring for disk latency and long-running queries, plus a maintenance job that clears single-use plans from the plan cache.
Before vs. After
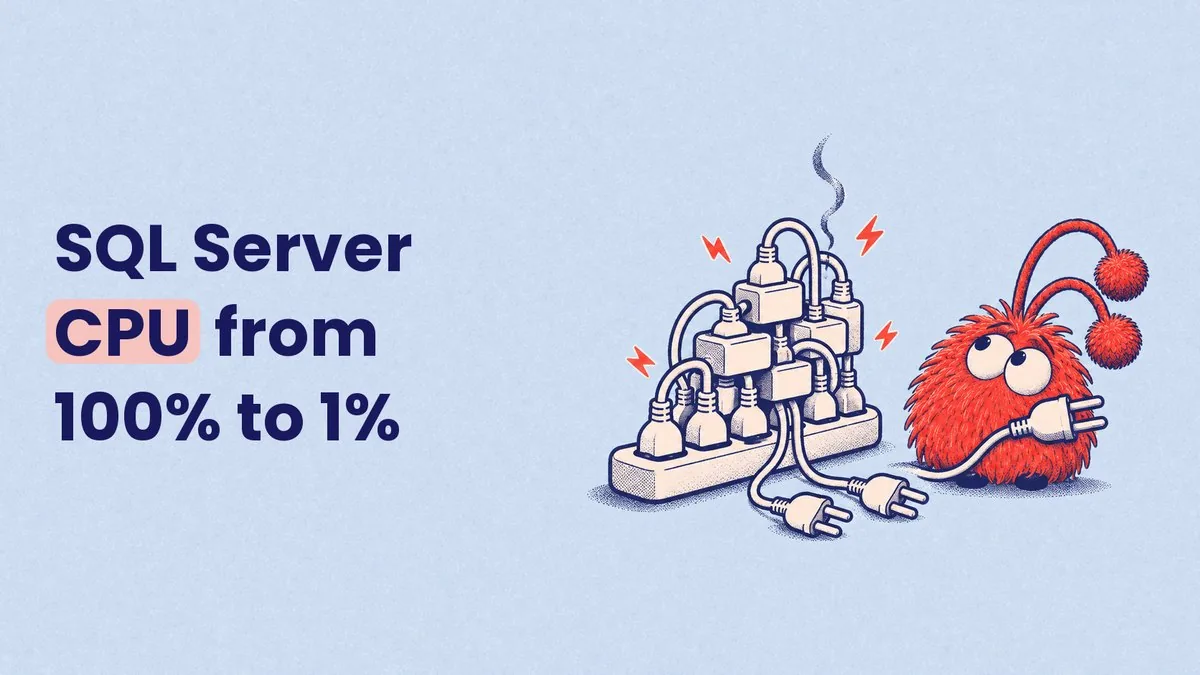
After the changes, CPU usage went down to 1%.
| Before | After | |
|---|---|---|
| CPU usage | up to 100% | 1% |
| Indexes on the table | 43 | 31 active |
| Cost threshold for parallelism | 5 | 50 |
| Max degree of parallelism | 0 (all cores) | 8 |
| Optimize for ad hoc workloads | Off | On |
We do not have a per-query before and after for this case. The server-level reading is the result, so that is the number we report.
Final thoughts
Extra indexes cost you. Every index has to be maintained on each write, and duplicates give the optimizer more ways to pick a bad plan.
The default parallelism settings are a common cause of CPU pressure too. A threshold of 5 lets small queries go parallel and fight each other for cores.
When your CPU is pegged, look at indexes and instance settings together. Here the fix was index cleanup plus three settings.