
Summary
A rapidly growing solution provider processing massive transaction volumes faced critical Azure SQL Database performance bottlenecks that threatened their entire 24/7 operation. With their current Premium P15 (4000 DTU) configuration maxed out and business growth accelerating, they needed to scale immediately, but didn’t know which Azure SQL configuration would handle their extreme workload.
Configuration before Replay: 1.6 terabytes of captured workload data from just 4 hours of operation, with CPU consistently hitting 100% and zero room for growth.
Solution: Red9’s distributed replay testing methodology using Microsoft Database Experimentation Assistant (DEA) to test six different Azure SQL configurations under real production conditions.
Results:
- 46% cost reduction ($15,700/month to $8,491/month)
- 15% performance improvement with 808ms average query duration vs 952ms baseline
- Massive scalability headroom with CPU utilization dropping from constant 100% to 60-80% range
- Zero downtime testing using captured production workload replay
- Avoided serverless disaster – configuration showed 57% worse performance despite similar cost
This case study demonstrates how proper performance testing methodology can prevent costly cloud migration mistakes and deliver both performance improvements and substantial cost savings for Enterprise companies.
When Success Becomes a Scalability Crisis
Critical Infrastructure Under Extreme Load
This payment platform provider processes transactions 24/7 across hundreds of locations in the United States.
Every failed transaction directly impacts:
- Customer experience at the point of sale
- Revenue collection for facility owners
- Brand reputation across their entire network
The business was experiencing explosive growth, but their Azure SQL Database infrastructure couldn’t keep pace. Their Premium P15 configuration with 4000 DTUs was consistently hitting 100% CPU utilization during business hours, creating a perfect storm.
Performance Symptoms
- Transaction timeouts during peak periods
- Query execution times exceeding acceptable thresholds
- Failed payment processing events
- Cascading failures affecting multiple facility locations
Technical Environment Constraints
- Current Platform: Azure SQL Database Premium P15 (4000 DTU)
- Database Size: 4+ terabytes
- Transaction Volume: 1.6 TB of activity captured in just 4 hours
- Extrapolated Daily Load: 9.6+ TB of daily transaction data
- Availability Requirement: 24/7 operations with zero tolerance for extended downtime
The High-Stakes Decision
The client had reached the upper limit of their current DTU-based pricing tier. They needed to migrate to a more powerful configuration, but choosing the wrong Azure SQL setup would mean:
- Expensive migration rollback if performance degraded
- Extended downtime during configuration changes
- Potential business disruption across their entire facility network
- Unknown cost implications with complex Azure pricing models
Without proper testing, they faced a critical decision with limited information and enormous financial risk.
If you’re facing a similar scaling limit or planning to move workloads to a different Azure SQL configuration, explore how Red9 handles SQL Server migrations with precision, rollback safety, and minimal downtime.
The Technical Challenge: Testing Extreme Workloads at Scale
Workload Capture Complexity
The sheer volume of database activity presented unique technical challenges:
Captured Workload Metrics:
- 4-hour capture period: 1.6 terabytes of transaction data
- File complexity: 3,060+ individual XEL (Extended Events) trace files
- Processing requirements: Multiple specialized tools needed for conversion and analysis
- Query volume: 113+ million executions in the test dataset
Azure SQL Database Testing Limitations
Testing Azure SQL Database configurations presented specific technical obstacles:
- Limited access compared to on-premises SQL Server installations
- Restricted tooling – traditional distributed replay tools don’t work with Azure SQL DB
- Capture methodology requiring Azure-specific tools like Database Experimentation Assistant (DEA)
- Performance measurement across different service tiers and configurations
Microsoft Database Experimentation Assistant (DEA) Implementation
Red9’s team selected DEA for this project because:
- Azure SQL DB compatibility – works with both source and target Azure environments
- User-friendly interface – simplified configuration and execution
- Production-safe capture – minimal impact on live systems during workload collection
- Comprehensive metrics – detailed performance analysis across multiple dimensions
Red9’s Distributed Replay Methodology
Phase 1: Production Workload Capture
Environment Setup:
- VM size: Standard E64bds v5 (64 vCores, high-memory configuration)
- Azure Region: North Central US
- Capture tool: Microsoft Database Experimentation Assistant (DEA)
Workload Capture Results:
- Duration: 4 hours of peak business activity
- Capture files: 3,060 XEL files
- Total size: 1.6 terabytes of raw transaction data
- Representative sampling: Peak transaction periods covering worst-case scenarios
Data Processing Pipeline:
- Raw capture: 1.6 TB across 3,060+ XEL trace files
- File consolidation: Converting multiple files into single analysis-ready format
- Workload preparation: Preparing for replay across different target configurations
Phase 2: Test Environment Configuration
Red9 configured six distinct Azure SQL Database test environments:
Configuration Matrix Tested
| Config | Service Tier | Model | vCores | Monthly Cost | Target Use Case |
|---|---|---|---|---|---|
| 1 (Baseline) | Premium | DTU | P15 (4000) | $15,700 | Current production |
| 2 | General Purpose | Serverless | 16 | $12,273 | Auto-scaling workload |
| 3 | Hyperscale | Provisioned | 40 | $6,357 | Consistent performance |
| 4 | Hyperscale | Provisioned (General Purpose) | 40 | $6,357 | Standard workload |
| 5 | Hyperscale | Provisioned (Memory Optimized) | 40 | $8,491 | Best performance target |
| 6 | Premium | DTU (SQL 2022) | P15 (4000) | $15,700 | Version upgrade baseline |
Phase 3: Distributed Replay Execution
Methodology:
- Each configuration received identical workload replay
- Multiple performance dimensions measured simultaneously
- Consistent test conditions maintained across all environments
Key Performance Metrics Tracked:
- Execution count: Number of successfully completed transactions
- CPU consumption: Total milliseconds of CPU time consumed
- Read operations: Disk I/O operations and latency
- Duration score: End-to-end query response times (most critical for user experience)
Performance Testing Results Analysis
Performance Findings
| Configuration | Executions | CPU Score | Reads Score (millions) | Duration Score | Monthly Cost |
|---|---|---|---|---|---|
| 1 – Current P15 / CL150* | 113,247,472 | 561,952 | 91.5 | 952 | $15,700 |
| 2 – General Purpose / Serverless (max 16 vCores) | 113,218,199 | 547,603 | 73.9 | 1,496 | $12,273 |
| 3 – Hyperscale Provisioned / 40vCores | 113,222,816 | 591,185 | 84.9 | 1,086 | $6,357 |
| 4 – Hyperscale Premium / 40vCores (General Purpose) | 113,491,183 | 649,432 | 83.9 | 1,151 | $6,357 |
| 5 – Hyperscale Memory Opt. / 40vCores | 113,449,768 | 546,581 | 95.3 | 808 | $8,491 |
| 6 – P15 / SQL 2022 / CL160 | 113,520,875 | 563,247 | 89.4 | 894 | $15,700 |
*CL – compatibility level
Performance Analysis
Duration Score: The User Experience Metric
Duration score represents end-to-end query response time – the metric customers actually experience.
Lower numbers indicate faster performance:
- Current baseline (P15): 952ms average response time
- Serverless (worst): 1,496ms – 57% slower than baseline
- Premium Memory Optimized (best): 808ms – 15% faster than baseline
CPU Efficiency Analysis
Configuration #5 (Premium Memory Optimized) achieved:
- 546,581ms CPU consumption vs 561,952ms baseline
- 2.7% CPU reduction while improving performance
- Significant headroom for future growth
Storage I/O Performance
Read operations varied significantly across configurations:
- Baseline: 91.5 million read operations
- Serverless: 73.9 million read operations (19% reduction)
- Memory Optimized: 95.3 million read operations (4% increase, but much faster execution)
Cost-Performance Analysis
Configuration #5 delivered the optimal balance:
- 46% cost reduction: $15,700 → $8,491 monthly
- 15% performance improvement: 952ms → 808ms response time
- Enhanced scalability: Significant CPU headroom for growth
Serverless configuration analysis:
- Similar cost: $12,273 vs $15,700 baseline
- 57% worse performance: 1,496ms vs 952ms baseline
- Conclusion: Marketing promises didn’t match real-world performance
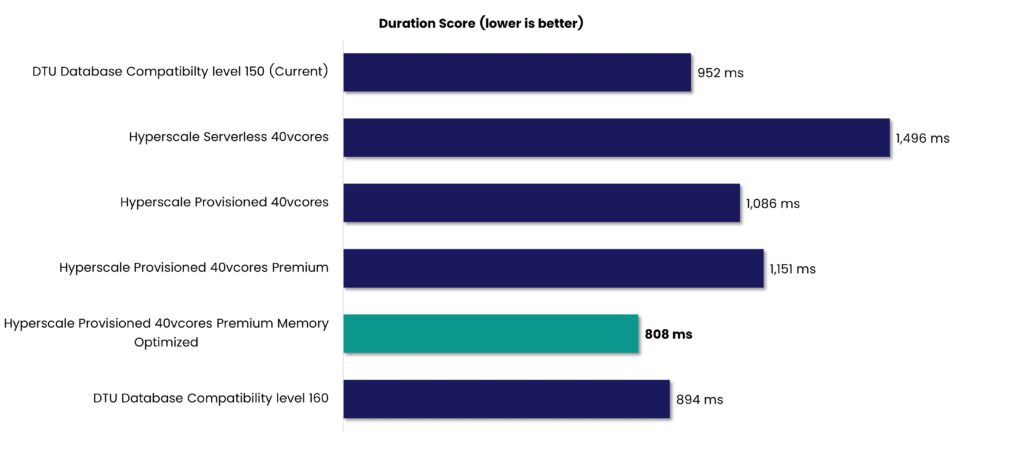
Fig.1. Duration Score (ms) comparison across Azure SQL Deployment Models.
CPU Utilization and Scalability Analysis
Current Environment: Running at Capacity
The standard P15 setup is under serious strain, with critical resource limits already being hit:
- CPU usage: Maxed out at 100% throughout business hours
- Growth capacity: Zero headroom for additional load
- Risk: Any traffic increase would cause immediate service degradation
- Replay duration: 4 hours 19 minutes (slightly longer than capture period)
Optimal Configuration: Scalable and Stable
Configuration #5 (Premium Memory Optimized) significantly improves system resilience and headroom:
- CPU usage: Averaging 60-80% during peak periods
- Growth capacity: 30-40% additional capacity available
- Stability: Consistent performance without resource exhaustion
- Replay duration: 4 hours 36 minutes (processing remains well within acceptable limits)
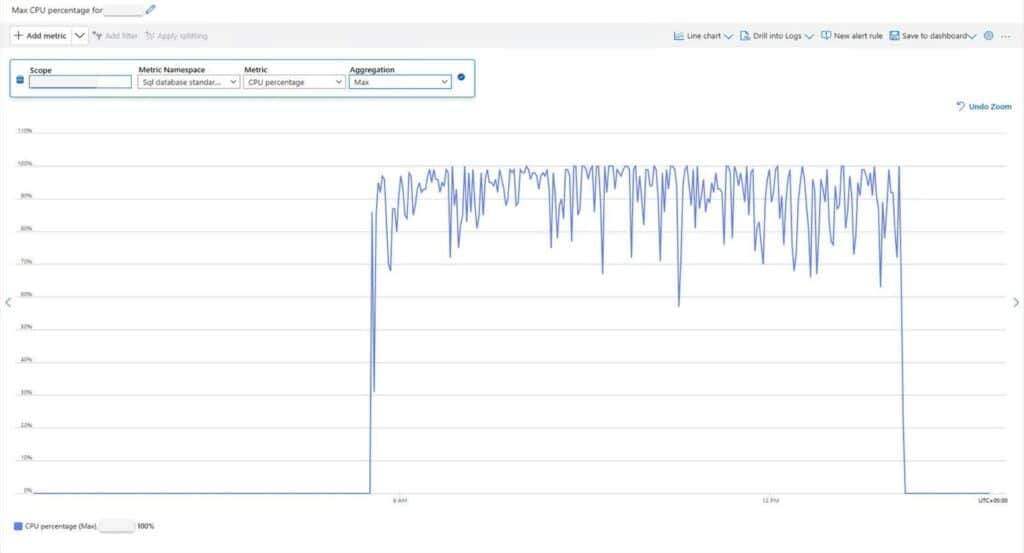
Fig. 2. Max CPU Utilization on Premium P15 (4000 DTUs), current environment
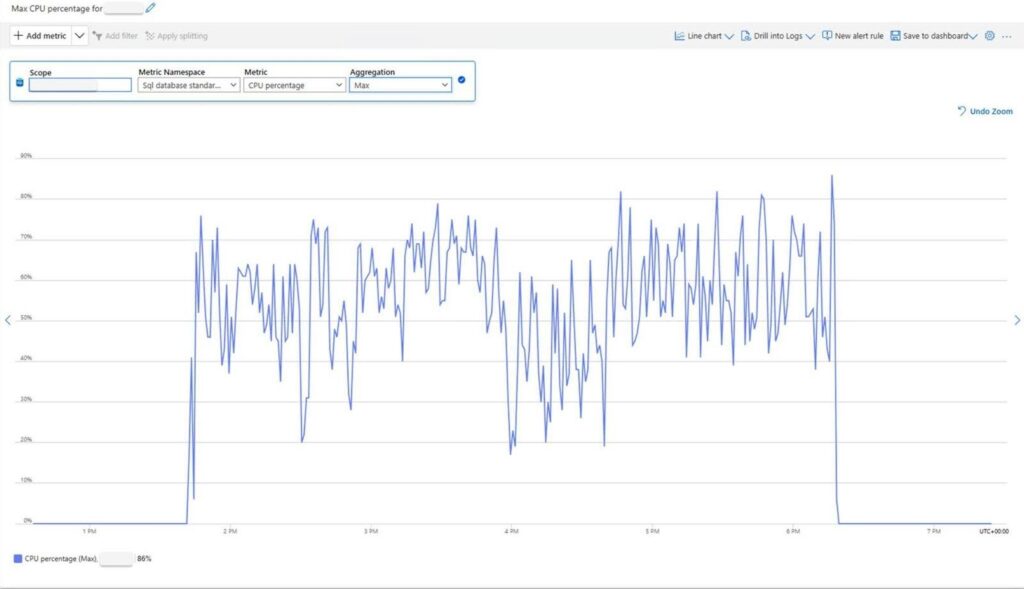
Fig. 3. Max CPU Utilization on Hyperscale Gen5 (40 vCores, Memory Optimized), new environment
Serverless Configuration: Performance Degradation
Testing revealed that the serverless setup struggles under sustained transactional demand:
- Unstable scaling: Visible scaling events causing performance disruption
- Extended duration: 6 hours to complete 4-hour workload (50% longer)
- Performance drops: Clear degradation during auto-scaling events
- Unsuitability: Not recommended for consistent high-volume transactional workloads
Version Upgrade Benefits
Configuration #6 (SQL Server 2022, compatibility level 160) was tested against the baseline Configuration #1 (SQL Server 2019, level 150):
- Duration improvement: 894ms vs 952ms (6% faster)
- Same cost: $15,700 monthly
- Conclusion: Version upgrade provides a moderate performance gain at no additional cost
Business Impact and ROI
Immediate Financial Benefits
Annual cost savings from optimal configuration:
- Previous annual cost: $188,400 ($15,700 × 12 months)
- Optimized annual cost: $101,892 ($8,491 × 12 months)
- Annual savings: $86,508
- ROI timeframe: Testing investment recovered in first month of operation
Performance Improvements
User experience enhancements:
- 15% faster response times across all transaction types
- Elimination of timeout issues during peak periods
- Improved system stability with substantial resource headroom
Scalability Benefits
Future growth accommodation:
- 30-40% additional capacity available without further infrastructure changes
- Predictable performance under varying load conditions
- Extended runway for business growth before next infrastructure evaluation
Risk Mitigation
Avoided potential costs:
- Migration rollback expenses if wrong configuration was chosen
- Business disruption costs from performance degradation
- Emergency infrastructure fixes during peak business periods
- Serverless performance issues that would have required immediate remediation
Technical Methodology: Distributed Replay Implementation
Tool Stack and Implementation
Primary Tools Used:
- Microsoft Database Experimentation Assistant (DEA): Azure SQL DB workload capture and replay
- Azure SQL Database: Target test environments across multiple service tiers
- Performance monitoring: Built-in Azure metrics and custom analysis scripts
- Standard E64bds v5 VM: High-performance testing infrastructure
Workload Capture Best Practices
Capture window selection:
- 4-hour duration: Balanced comprehensive data capture with manageable processing requirements
- Business hours focus: Captured peak transaction periods representative of worst-case scenarios
- Representative sampling: Avoided weekly/monthly reporting cycles that could skew results
Data processing considerations:
- File size management: 1.6TB across 3,060 XEL files required specialized processing pipeline
- Tool limitations: DEA replay tools required careful file consolidation and processing
- Selective replay: Focused on most critical transaction patterns for accurate representation
Azure SQL Configuration Decision Framework
DTU vs vCore Model Comparison
DTU Model Limitations (Current P15):
- Fixed resource allocation: Cannot adjust CPU independently from storage
- Scaling constraints: Limited upgrade path beyond P15
- Cost inefficiency: Paying for bundled resources not fully utilized
vCore Model Benefits (Hyperscale):
- Granular control: Independent CPU, memory, and storage scaling
- Performance tiers: Multiple optimization options for different workload patterns
- Cost flexibility: Pay only for resources actively used
Hyperscale Tier Selection Criteria
Provisioned vs Serverless Analysis:
Provisioned Model – Optimal for consistent workloads:
- Predictable performance: Dedicated resources guarantee consistent response times
- Cost predictability: Fixed monthly pricing regardless of utilization patterns
- High-volume suitability: Designed for sustained transaction processing
Serverless Model – Problematic for transaction-heavy workloads:
- Auto-scaling delays: Scaling events cause significant performance degradation (50% longer processing time)
- Unpredictable costs: Billing based on actual consumption with scaling overhead
- Performance variability: Response times fluctuate dramatically during scaling events (57% worse than baseline)
Memory Optimization Impact
Premium Memory Optimized configuration benefits:
- Enhanced buffer pool: Larger memory allocation reduces need for disk I/O
- Query plan caching: More memory available for execution plan optimization
- Concurrent user support: Better resource allocation for high-volume environments
- Cost-performance balance: Best overall value at $8,491/month
Conclusion: The Strategic Value of Performance Testing
This hyperscale performance testing effort highlights why infrastructure decisions need to be grounded in real data.
Without distributed replay testing, this client would likely have:
- Selected the wrong configuration: Serverless appeared cost-effective but delivered 57% worse performance
- Overpaid for infrastructure: The Current path would have cost 46% more monthly
- Limited growth capacity: The Chosen configuration might not have accommodated business expansion
- Risked business continuity: Poor performance could have impacted customer transactions across hundreds of facilities
Key takeaways for enterprise decision-makers:
- Never guess on critical infrastructure: Testing methodologies exist – use them before making expensive commitments
- Cloud marketing vs. reality: Vendor recommendations don’t always match real-world workload requirements
- Performance testing ROI: Testing investment pays for itself through optimized configuration selection
- Distributed replay effectiveness: Real production workload simulation provides actionable insights that synthetic testing cannot match
The Bottom Line
Red9’s distributed replay testing methodology delivered:
- 46% cost reduction ($86,508 annual savings) with improved performance
- 15% faster response times, enhancing user experience across all facilities
- Eliminated migration risk through comprehensive configuration analysis
- Provided a scalability roadmap with 30-40% additional capacity for future growth
- Established performance baseline for ongoing optimization
Distributed replay testing is a core part of infrastructure due diligence in enterprise environments that process high-volume transactions. It ensures performance remains stable and budgets stay on track.
Speak with a SQL Expert
In just 30 minutes, we will show you how we can eliminate your SQL Server headaches and provide operational peace of mind

