SQL Server Performance Tuning is a vast topic.
Tuning can get complicated, and the struggle is real.
Fixing a slow query and solving performance problems can involve hours of research and testing.
I will show you how you can use the query wait statistics to troubleshoot slow queries.
Query wait statistics
Microsoft added a new Dynamic Management View (DMV), sys.dm_exec_session_wait_stats, in SQL Server 2016. It provides information about wait statistics for an active session.
This ability of SQL Server to monitor wait statistics from a query execution (what query waits for and how long at each step of execution) is a powerful and precise tool for determining the root causes of the slow query execution.
How to find out what your query is waiting on?
Query wait statistics in the execution plan
One significant enhancement in the SQL Server 2016 SP1 was to query execution plans.
Thenceforth, you can view the wait statistics information of the query within the actual execution plan.
In order to take advantage of the SQL execution plan, we need to be granted the SHOWPLAN permission to generate the execution plan.
Members of the sysadmin, dbcreator, or db_owner will be able to create the execution plans without trouble.
Runtime Metrics
To see these runtime metrics in action, let’s use the query below, which usually takes a few seconds to complete.
SELECT TOP (10000) a.*
FROM master..spt_values a
	,master..spt_values b
ORDER BY a.Number DESC
	,b.number DESC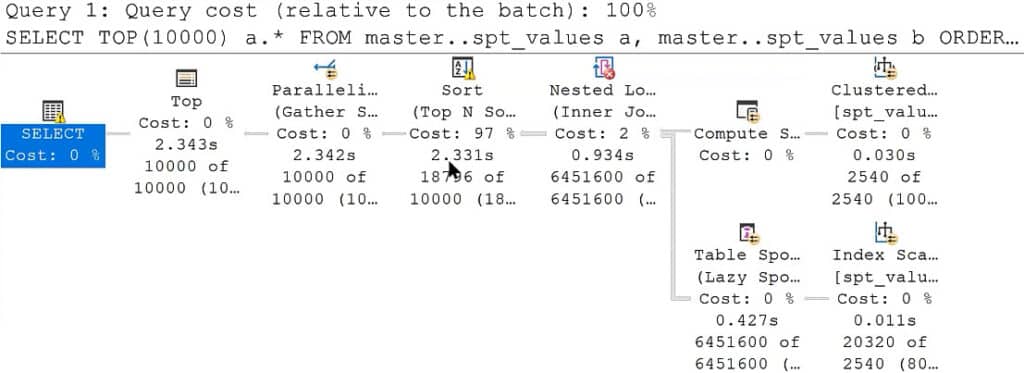
This time, the query completed the execution in 31 seconds.
There are several points of attention here, which will be disregarded to simplify the example.
As you can see above, the sort operation has 97% of the total cost of this operation, but it takes only 2.331 seconds to complete.
Where was the rest of the execution time spent?
If I choose the SELECT and go into the Properties of the operator, we will find the WaitStats.
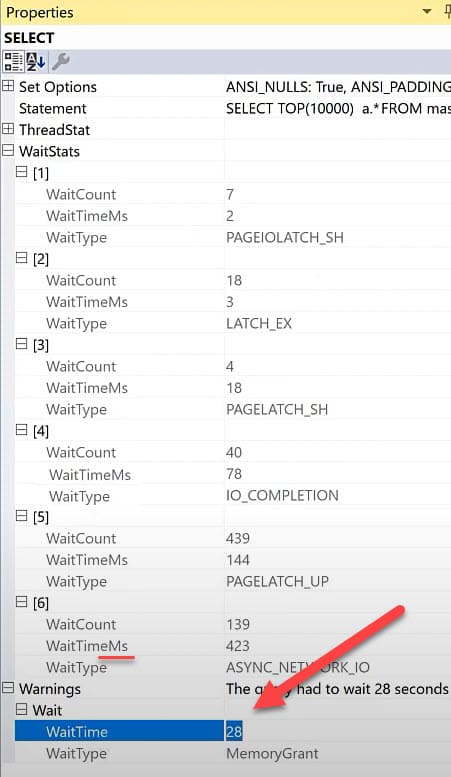
In the screenshot above, after expanding all nodes, we can quickly figure out that there is a problem.
At the bottom, the warning node within WaitType: MemoryGrant is 28 seconds (note that the other wait types are in milliseconds).
Over the years, I have seen this to be one of the most common memory-related issues.
Applications often execute seemingly simple queries that end up wreaking tons of performance havoc on the SQL Server side because of huge sort or hash operations.
These not only end up consuming a lot of SQL Server memory during execution but also cause other queries to have to wait for the memory to become available (thus the performance bottleneck).
In short, you can use this valuable information to guide the in-depth investigation in the right direction.
Using DMVs PerfMon counters, and other tools, you can find which queries are large-grant consumers and can be tuned.
Query wait statistics in Extended Events
Before SQL Server 2016, obtaining this information was a bit more challenging. If you are using SQL 2012 or 2014, you can set an extended event capture.
Unfortunately, you have to know the session_id for the query, and you have to set up data capture in advance – which isn’t trivial when you’re in the middle of a high-priority issue.
So, let me show you how to set up an extended event to capture the same information:
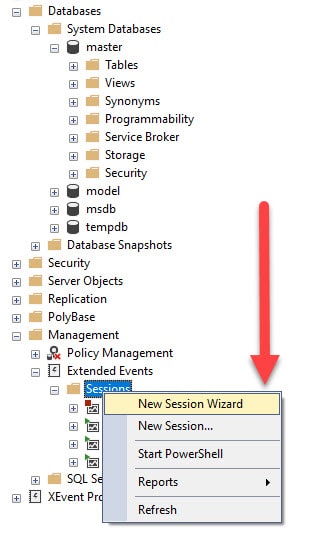
- On SQL Server Management Studio (SSMS), go to Extended Events and create a New Session Wizard.
- Capture an event called
wait_info. It will show the wait stats and their duration.
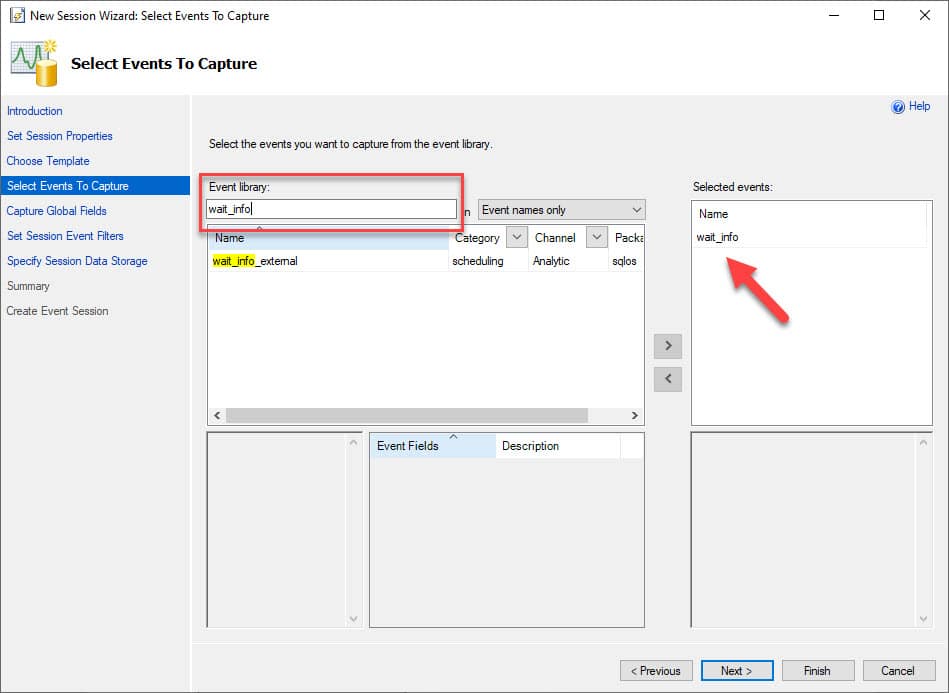
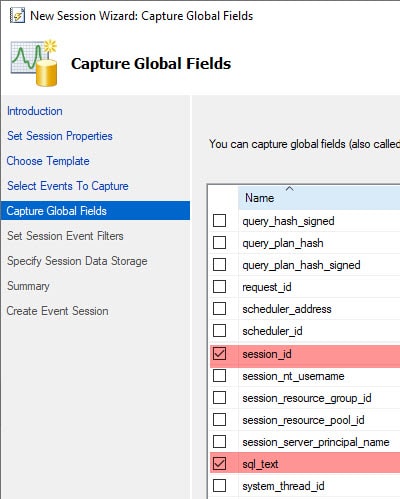
- You need to ensure that you filter this information. Thus, you will want to add Global Fields to filter and reduce the overhead on the server and the amount of data collected.
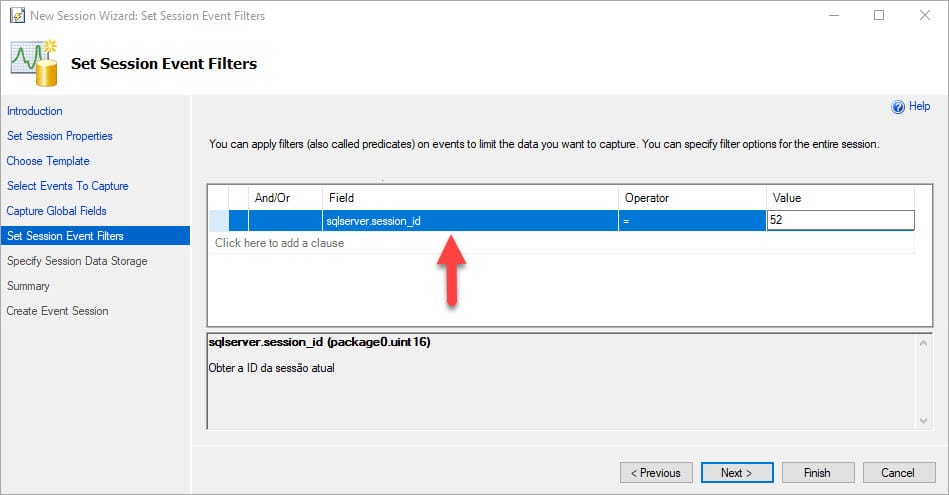
- In this case, I am setting the value 52 (my session_ID) on Event Filters.
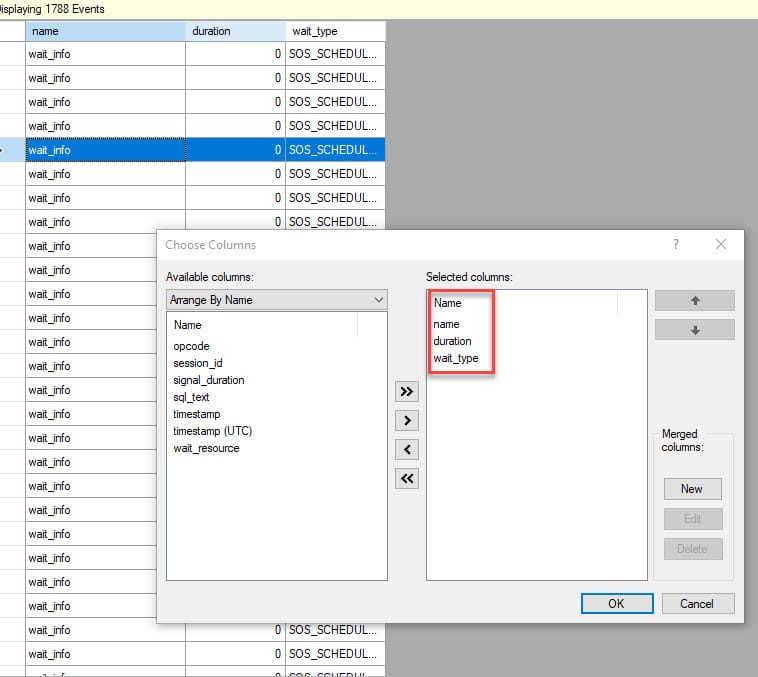
- Right-click on the result and remove the columns that you don’t need (keep only the name, wait_type, and duration).
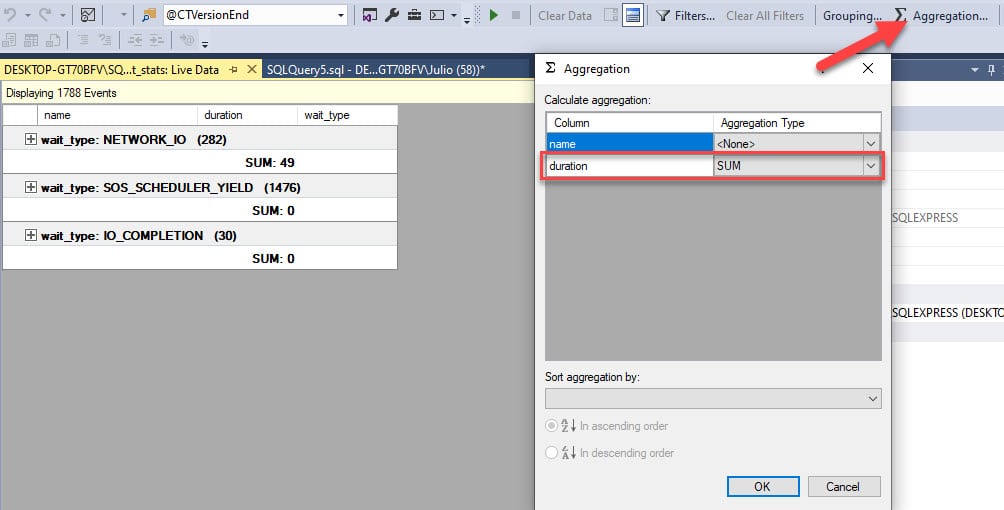
- In the next step, group the events by wait_type (on the Grouping tab).
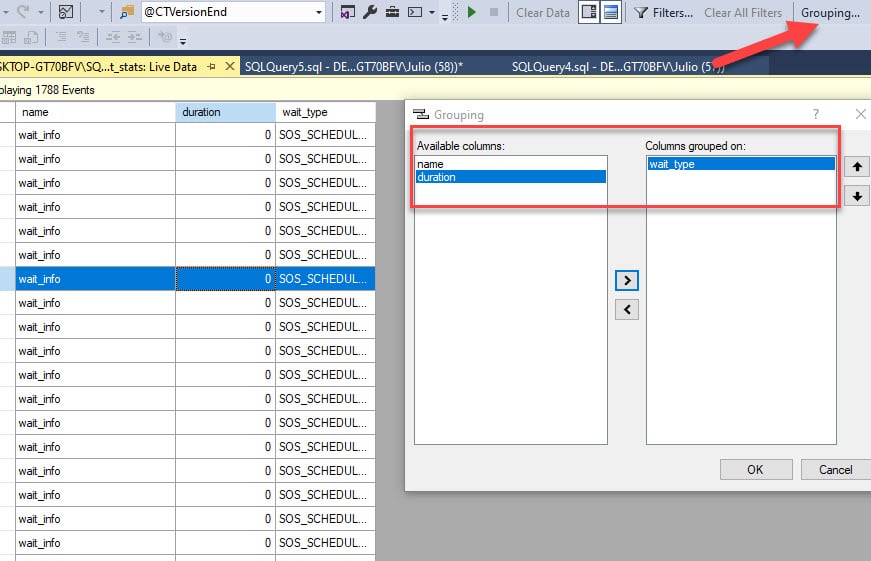
- And finally, aggregate them by SUM (Aggregation tab).
Alternatively, you can also create an Extended Event capture using the script below.
Note: remember to replace the value for the variable [sqlserver].[session_id].
CREATE EVENT SESSION [Query_wait_stats] ON SERVER ADD EVENT sqlos.wait_info (ACTION(sqlserver.session_id, sqlserver.sql_text) WHERE ([sqlserver].[session_id] = (52))) ADD TARGET package0.ring_buffer
	WITH (STARTUP_STATE = ON)
Another recommended way to deal with query wait stats is to use the wait statistics captured by the Query Store.
You can access more information here.
The only drawback to this method is that you have to be running Azure SQL Database or SQL Server 2017 onwards.
There was a time when this was actually kind of difficult. However, now we have a lot of different tools to capture query wait statistics.
As you can see, the wait statistics are one of the most powerful tools in your troubleshooting toolbox.
The learning curve is short and steep, so if you’re not already using them, now is the time to start.
Speak with a SQL Expert
In just 30 minutes, we will show you how we can eliminate your SQL Server headaches and provide operational peace of mind

