Troubleshooting performance issues doesn’t start with guesswork – it starts with monitoring.
A 2023 IDC study found that 65% of database performance issues come down to poor monitoring or optimization. When systems start crawling, admins often get the blame, but without proper tools, it’s hard to know what’s really going on under the hood.
That’s where SQL Server Performance counters come in. Built right into Windows, they help you track the server’s health in real time and uncover the root cause of slowdowns.
This guide breaks down the key metrics worth watching, what they tell you about your server’s performance, and how to start collecting the right data today.
Why SQL Server Performance Counters Are Essential?
When users notice that web pages or other systems are running slow, they start complaining to the System or database administrators.

How to know if your database is running fine and is not bottlenecked in this situation? Using a built-in Microsoft tool called Performance Monitor is one of many possible options to begin an investigation.
How to use PerfMon?
There are several ways to open the Performance Monitor window.
The easiest one is to click on the Start button on the taskbar (or push the Windows button on your keyboard), type in “Performance Monitor“ and hit Enter.
You should see the default graph of processor time. At this point, it is easy to right-click on this graph, choose Add Counters, select them and get instant results.
Setting Up Performance Monitoring
It is worth collecting performance counters data for a longer period and comparing non-peak time and days versus peak ones.
How to do this? Follow these simple steps:
Firstly, you have to create a Data Collector Set:
- On the Performance Monitor window already opened, expand Data Collector Sets.
- Right-click on User Defined, and choose New > Data Collector Set.
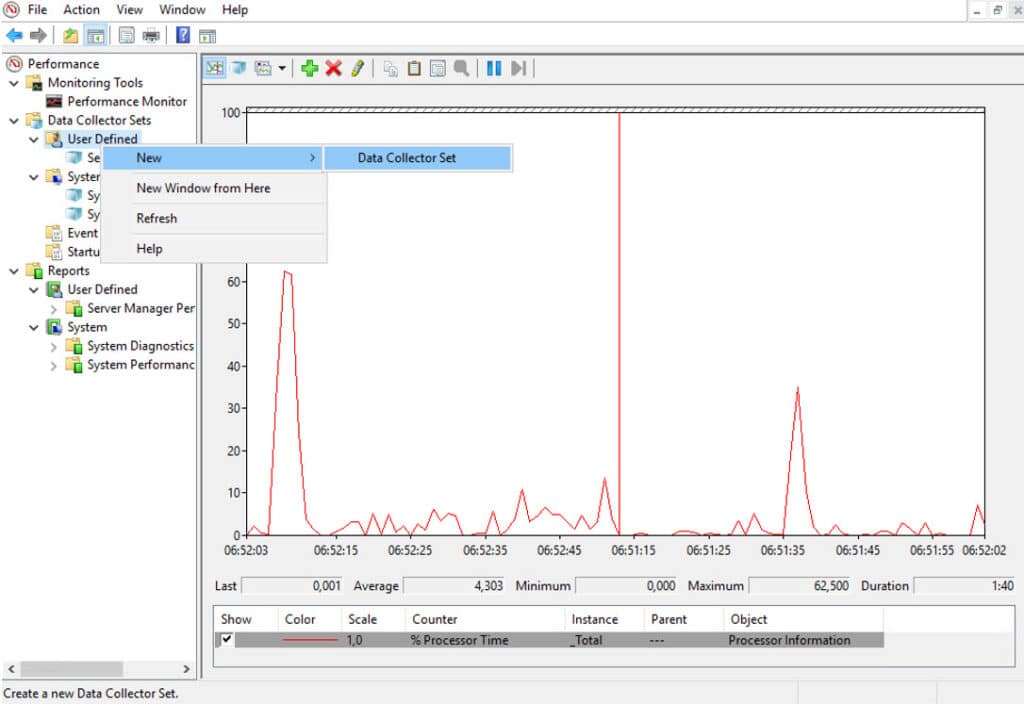
- On the new window, enter a name (example – “SQL Server performance metrics“), choose Create Manually (Advanced) and then Next.
- On the Create Data Logs radio button, tick a box on the Performance Counter and click Next.
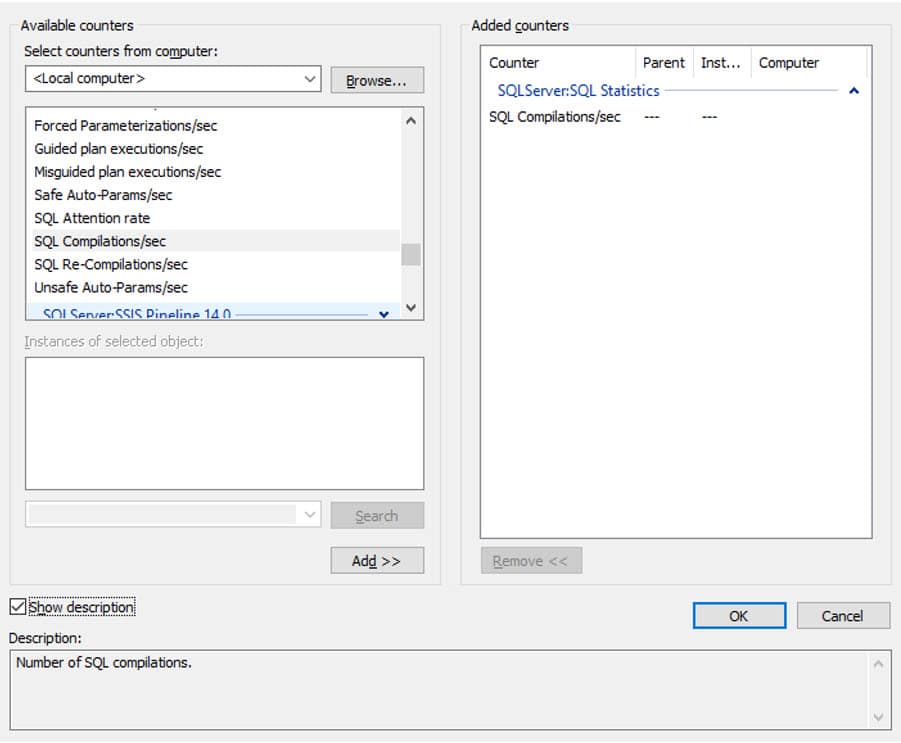
- Click Add and select the counters you are interested in, and click Add after each selected counter. You can also choose a local computer or a remote machine to collect data from. The next paragraph will have a list of recommended counters for the SQL Server instance running on Microsoft Server.
Figure 2 shows the example performance counter selected.
Configuring Collection Intervals
After all required performance counters were added, a sample interval can be chosen.
Remember that intervals that are too small may generate a huge amount of data that may be harder to render.
A large interval may not have enough data for investigation. The recommendation is to start the interval for 1 minute (if capture runs for a day) and later adjust by specific counters selected and personal requirements. Click Next.
Pro Tip: In SQL Server consulting, one overlooked trick during live troubleshooting is setting your PerfMon collection interval to 15–30 seconds - but only for short bursts.
This helps catch sporadic spikes (e.g., memory grants pending or blocked processes) that longer intervals often miss.
Just don’t let it run too long, or you’ll end up drowning in data and possibly slow down the instance further.
- On the “Where would you like the data to be saved?“ window, we would recommend choosing the drive that will not be collecting data from (in case any disk counter is used). Click Next.
- Now Run As: User might be specified. Otherwise, leave <Default> value, choose Save and Close, and click.
- When a new user-defined template is available, right-click on it and choose Start like it is shown in Figure 3.
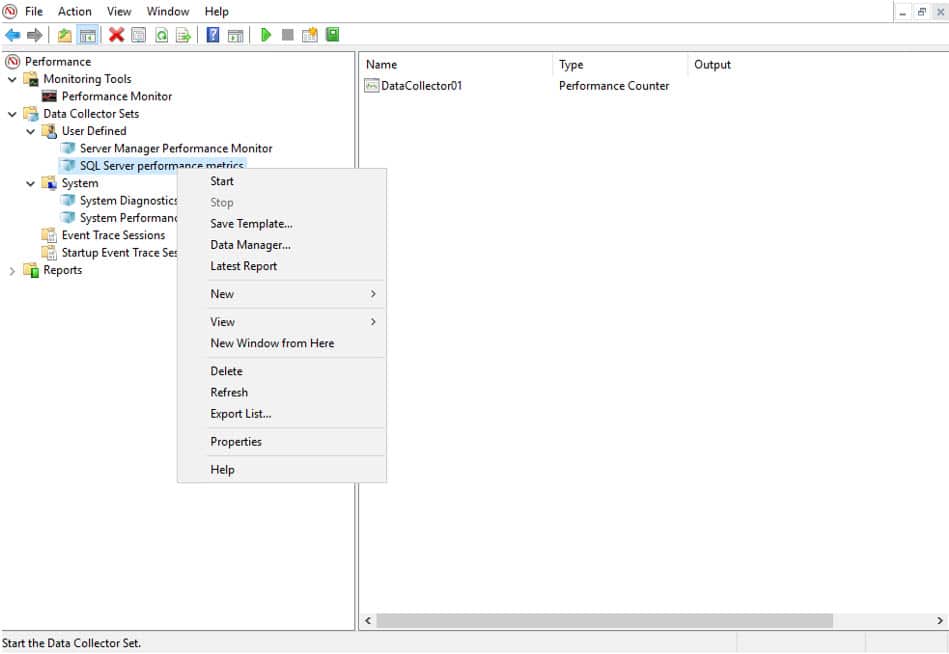
Let them run for a while. It can also be scheduled, for example, to start daily. To do this, instead of Start, choose Properties and then the Schedule tab.
Our recommendation is to keep collecting running no longer than one day (and then start again if needed) for possible overhead.
Top 12 SQL Server Performance Counters
The table below contains the recommended performance counters for SQL Server instances:
| Object | Counter | Description |
|---|---|---|
| SQLServer: SQL Statistics | Recompilations/sec | Statement recompiles per second count. |
| SQLServer: SQL Statistics | Compilations/sec | SQL compilations per second count. |
| SQLServer: SQL Statistics | Batch Requests/sec | T-SQL command batches received per second. |
| SQLServer: Memory Manager | Memory Grants Pending | Total number of processes waiting for a memory grant. |
| SQLServer: General Statistics | Processes blocked | Currently blocked processes count. |
| System | Processor Queue Length | Collects number of threads waiting for processor time. |
| Memory | Available MBytes | Collects memory available in Megabytes. |
| Physical Disk | Avg. Disk sec/Read | Average time in seconds of read data from the disk. |
| Physical Disk | Avg. Disk sec/Write | Average time in seconds of write data to the disk. |
| Physical Disk | Disk Reads/sec | Rate of read operations on the disk. |
| Physical Disk | Disk Writes/sec | Rate of write operations on the disk. |
| Processor | % Processor Time | Percentage of elapsed time the processor spends executing non-idle threads. |
More details on performance counters can be found on the Microsoft monitor resource usage page.
Analyzing results
When there is any result collected, on the Performance Monitor window, expand Reports, User Defined, and open the report under “ SQL Server performance metrics“ (or another name specified previously), like in Figure 4.

Understanding Counter Relationships
During the investigation, keep in mind that one counter can be closely related to another one.
For example, suppose SQL Server does not have enough memory dedicated.
In that case, it may start writing to disk instead and increase its performance counters of disk activity (even if the root cause is different).
Key Takeaway: Always correlate counters across different subsystems – memory, disk, CPU, and SQL-specific stats. The first metric you notice might just be the result, not the cause.
Common Mistakes to Avoid
Errors in monitoring SQL Server performance counters challenge even skilled professionals. These missteps can lead to wasted effort, missed bottlenecks, and unnecessary hardware spending.
- Tracking Too Many Counters
Loading up PerfMon with dozens of counters might feel thorough, but it often buries the signal under noise. Stick to the core 10–12 counters tied directly to CPU, memory, disk, and query throughput. Expand only when chasing a known issue.
For example, obsessing over “Cache Hit Ratio” without context may make you miss a creeping % Processor Time spike that’s actively degrading user response times.
If alert volume is drowning out real issues, consider tightening thresholds and escalation paths—this workflow is outlined in our SQL Server Monitoring & Alerts guide. - Skipping Baselines
Raw numbers mean nothing without context. A sudden jump to 1,500 Batch Requests/sec could look like a win – or a red flag – depending on your normal patterns.
Always establish baselines during peak, off-peak, and maintenance hours. This is the only way to tell whether a metric is healthy or hiding a problem. - Misreading Hardware Signals
Just because Disk Writes/sec are high doesn’t mean the disks are to blame. Often, it’s memory pressure or missing indexes forcing excess tempdb usage or sort spills.
Performance counters show symptoms, not causes. Before blaming SQL Server, validate hardware health: disk latency, memory sufficiency, CPU saturation, and controller performance.
Pro Tip: Run a lightweight hardware review monthly - not just when things go wrong. Look for creeping failures (like disk reallocation events or ECC memory corrections) that often go unnoticed until the damage is done.
Want more tips and know-how? Check out more articles for practical resources and expert advice to boost your SQL Server game.
Frequently Asked Questions
How do I monitor SQL Server performance?
What critical threshold values should I watch when monitoring database performance?
- Memory Grants Pending > 0 → memory pressure
- Processor Queue Length > 2 per core → CPU bottleneck Disk sec/Read or Write > 20ms → slow I/O
- Blocked Processes > 5 → contention
- Batch Requests/sec drop → system strain or blocking
What’s the monitoring impact on a production instance?
Which metrics should I prioritize differently for OLTP vs. data warehouse workloads?
What’s the best interval for collecting PerfMon data?
Which performance counters often reveal hidden problems?
- Memory Grants Pending → slow-running or queued queries
- Page Life Expectancy dropping fast → memory churn
- SQL Compilations/sec spiking → missing plan reuse
- Disk Queue Length > 1-2 → disk is lagging behind
Can I use PerfMon and DMVs together?
How can Red9 help with SQL Server performance monitoring?
Speak with a SQL Expert
In just 30 minutes, we will show you how we can eliminate your SQL Server headaches and provide operational peace of mind

